Mathematics and Statistics Practice Questions
What is the product of  and
and  ?
?
6×3+29×2+26x-21
What is the product of  and
and  ?
?
6×3+19×2+12x-5
What is the product of  and
and  ?
?
6×3+24×2+x18x-12
What are the zeros of the function  ?
?
x=-1/2x=-4
What are the zeros of the function  ?
?
x=-1/2x=-3
What are the zeros of the function  ?
?
x=-1/2x=-2
What are the solutions of the equation  ?
?
½ -⅓
What are the solutions of the equation  ?
?
-½ ⅓
What are the solutions of the equation  ?
?
-½ -⅓
Which equation shows  rewritten by completing the square?
(x+3)2=13
Which equation shows x2 + 6x – 6 = 0 rewritten by completing the square?
(x+3)2=15
Which equation shows  rewritten by completing the square?
(x+3)2=11
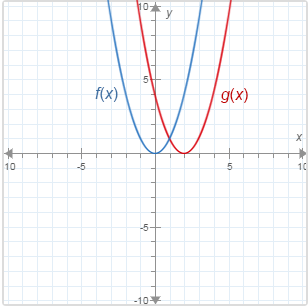
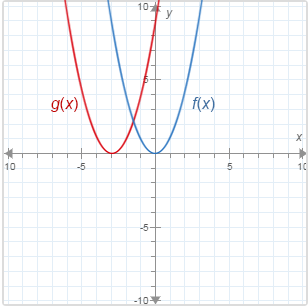
The graphs below have the same shape. f(x) = x2.
What is the equation of the graph of g(x)?
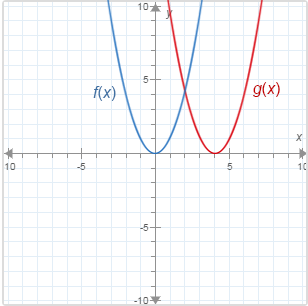
The graphs below have the same shape. f(x) = x2.
What is the equation of the graph of g(x)?
The graphs below have the same shape. f(x) = x2.
What is the equation of the graph of g(x)?
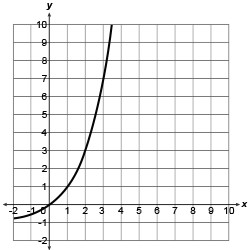
The graph of g(x), shown below, is a vertical shift of the graph of f(x) = 3x. Write the equation for g(x).
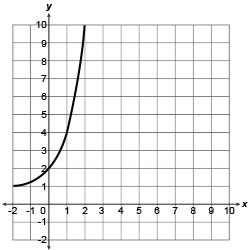
The graph of g(x), shown below, is a vertical shift of the graph of f(x) = 2x. Write the equation for g(x).
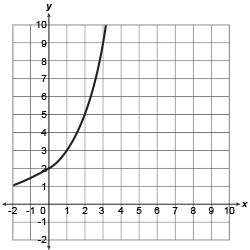
The graph of g(x), shown below, is a vertical shift of the graph of f(x) = 2x. Write the equation for g(x).
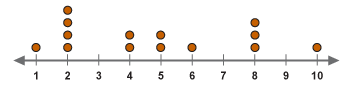
The applicants for a soccer coaching position were asked how many years of coaching experience they had. Here are the results:
1, 2, 2, 2, 2, 4, 4, 5, 5, 6, 8, 8, 8, 10
On a piece of paper, draw a dot plot to represent the data. Then determine which answer choice matches the dot plot you drew.
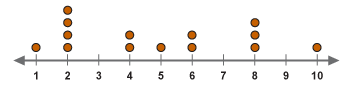
The applicants for a soccer coaching position were asked how many years of coaching experience they had. Here are the results:
1, 1, 2, 2, 2, 4, 4, 5, 6, 6, 8, 8, 8, 10
On a piece of paper, draw a dot plot to represent the data. Then determine which answer choice matches the dot plot you drew.
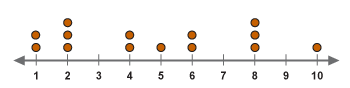
The applicants for a soccer coaching position were asked how many years of coaching experience they had. Here are the results:
1, 1, 2, 2, 2, 4, 4, 5, 6, 6, 8, 8, 8, 10
On a piece of paper, draw a dot plot to represent the data. Then determine which answer choice matches the dot plot you drew.
These box plots show shark attack data for the years 2005 to 2014 in Florida and Australia.

Which statement best compares the spreads of the data sets?
The interquartile range (IQR) for Florida, 11, is greater than the IQR for Australia, 4.
These box plots show the number of points scored per game for two professional basketball players, Michael Jordan and Wilt Chamberlain, over the first 10 years of their careers.

Which statement best compares the spreads of the data sets?
The interquartile range (IQR) for Chamberlain, 14, is greater than the IQR for Jordan, 6.
These box plots show the number of electoral votes won by Democratic and Republican presidential candidates for the elections from 1984 through 2012.
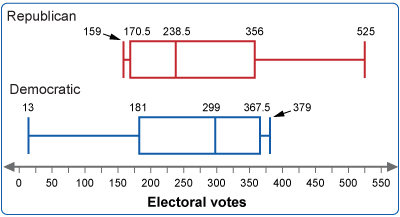
Which statement best compares the spreads of the data sets?
The interquartile range (IQR) for Democratic electoral votes, 186.5, is very nearly equal to the IQR for Republican votes, 185.5.
These dot plots show hourly earnings for a sample of workers in two different careers.
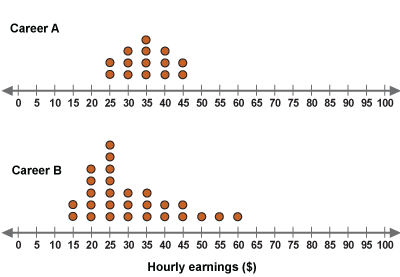
What are the differences between the centers and spreads of these earning distributions?
Select two choices: one for the centers and one for the spreads.
Centers: Career A has greater median hourly earnings than career B.
Spreads: The hourly earnings for career B are more spread out.
These dot plots show hourly earnings for a sample of workers in two different careers.
What are the differences between the centers and spreads of these earning distributions?
Select two choices: one for the centers and one for the spreads.
Centers: Career B has greater median hourly earnings than career A.
Spreads: The hourly earnings for career B are more spread out.
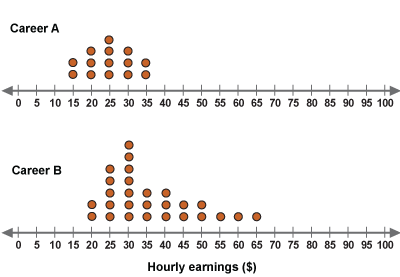
These dot plots show hourly earnings for a sample of workers in two different careers.

What are the differences between the centers and spreads of these earning distributions?
Select two choices: one for the centers and one for the spreads
Centers: Career A has greater median hourly earnings than career B.
Spreads: The hourly earnings for career A are more spread out.
In a survey at a shoe store, 200 customers were asked whether they have running shoes or basketball shoes. The results are in the relative frequency table.
What percentage of the people surveyed have basketball shoes?
46%
In a survey at a shoe store, 200 customers were asked whether they have running shoes or basketball shoes. The results are in the relative frequency table.
What percentage of the people surveyed have basketball shoes?
42%
In a survey at a shoe store, 200 customers were asked whether they have running shoes or basketball shoes. The results are in the relative frequency table.
What percentage of the people surveyed have basketball shoes?
54%
At a high school, 9th and 10th graders were asked whether they would prefer robotics or art as an elective. The results are shown in the relative frequency table.
To the nearest percent, what percentage of 10th graders surveyed preferred robotics?
61%
At a high school, 9th and 10th graders were asked whether they would prefer robotics or art as an elective. The results are shown in the relative frequency table.
To the nearest percent, what percentage of 10th graders surveyed preferred robotics?
39%
At a high school, 9th and 10th graders were asked whether they would prefer robotics or art as an elective. The results are shown in the relative frequency table.
To the nearest percent, what percentage of 10th graders surveyed preferred robotics?
30$
Which of the following r-values represents the strongest correlation?
–0.91 –0.81 –0.71
There is a strong positive linear correlation between temperature and the height of corn plants. Does this mean that higher temperatures cause the corn to grow taller?
No. Any number of factors could also be affecting the height of the corn.
There is a strong positive linear correlation between the number of clear days and the height of bean plants. Does this mean that more clear days cause the bean plants to grow taller?
No. Any number of factors could also be affecting the height of the bean plants.
There is a strong positive linear correlation between the number of rainy days and the number of tomatoes produced on a tomato plant. Does this mean that more rainy days cause the tomato plants to produce more?
No. Any number of factors could also be affecting the number of tomatoes produced.
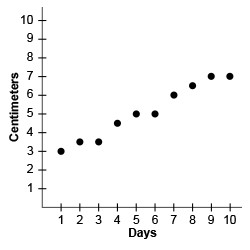
Rosa recorded the height (in centimeters) of a pea plant over a 10-day period for a science experiment. Which equation is the best model of the data?
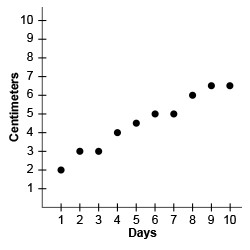

Araceli recorded the height (in centimeters) of a pea plant over a 10-day period for a science experiment. Which equation is the best model of the data?
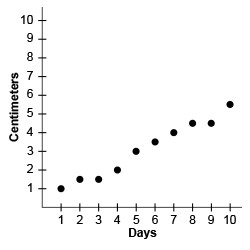
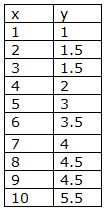
Marisol recorded the height (in centimeters) of a pea plant over a 10-day period for a science experiment. Which equation is the best model of the data?