GDP, Economic Growth, Welfare and Market Dynamics
GDP, Economic Growth & Welfare
GDP
Gross Domestic Product (GDP) refers to the market value of all final goods and services produced within a country in a given year. Only final goods are included to avoid double counting. GDP excludes transfer payments, second-hand goods, non-market activities such as household work, and the underground economy.
Nominal GDP
Nominal GDP measures output using current year prices. As prices may increase due to inflation, nominal GDP can rise even when the actual quantity of goods and services produced remains unchanged. As a result, nominal GDP is not suitable for comparing economic performance across different years and may overstate economic growth during periods of inflation.
Real GDP
Real GDP measures output using constant prices from a base year. By holding prices constant, the effect of inflation is removed. An increase in real GDP therefore indicates that more goods and services are actually produced, making real GDP a more accurate indicator of economic performance over time.
Base Year
The base year is the year in which the GDP price deflator equals 100. Prices from this year are used to calculate real GDP. Over time, consumption patterns may change, so rebasing is sometimes required to maintain accuracy.
Example: Singapore’s base year is 2010.
GDP Price Deflator
The GDP price deflator measures the overall price level of domestically produced goods and services.
GDP Price Deflator = (Nominal GDP ÷ Real GDP) × 100
Real GDP = (Nominal GDP × 100) ÷ GDP Price Deflator
The inflation rate can be calculated using the percentage change in the GDP price deflator. Unlike the Consumer Price Index (CPI), the GDP deflator excludes imported goods and focuses on output prices rather than cost of living.
Economic Growth
Economic growth is defined as the percentage change in real GDP from one year to the next.
Economic growth rate = (Real GDPt − Real GDPt-1) ÷ Real GDPt-1 × 100%
A positive growth rate indicates economic expansion, while a negative growth rate indicates a recession.
Recession and Recovery Shapes
A recession refers to a period of negative economic growth.
- V-shaped recovery: a sharp decline followed by a rapid recovery.
- U-shaped recovery: a prolonged downturn and gradual recovery.
- W-shaped recovery: (double-dip recession) occurs when the economy falls again shortly after recovering.
The speed of recovery depends on government policies, business confidence, consumer confidence, and global economic conditions.
Importance of Economic Growth
Sustained economic growth leads to higher output, higher incomes, and increased employment. It also enables governments to spend more on public services such as education, healthcare, and infrastructure, improving long-term productive capacity.
GDP per Capita
GDP per capita is calculated by dividing GDP by the population. It is commonly used as a proxy for average standard of living, but it does not measure overall welfare.
Limitations of GDP and GDP per Capita
GDP does not account for income inequality, non-market activities, or the underground economy. It ignores leisure time, work-life balance, pollution, congestion, and environmental damage. It also fails to reflect the quality and variety of goods produced. Therefore, economic growth does not necessarily imply economic development, which also includes health, education, and quality of life.
Income vs Expenditure Approach
Under the income approach, GDP is calculated by summing wages, rent, interest, and profits.
Under the expenditure approach, GDP is calculated as C + I + G + (X − M).
Both approaches yield the same value due to the circular flow of income, where spending becomes income.
Demand, Supply & Market Adjustment
Wants vs Demand
Wants refer to desires, while demand exists only when consumers have both the willingness and ability to pay at a given price.
Law of Demand
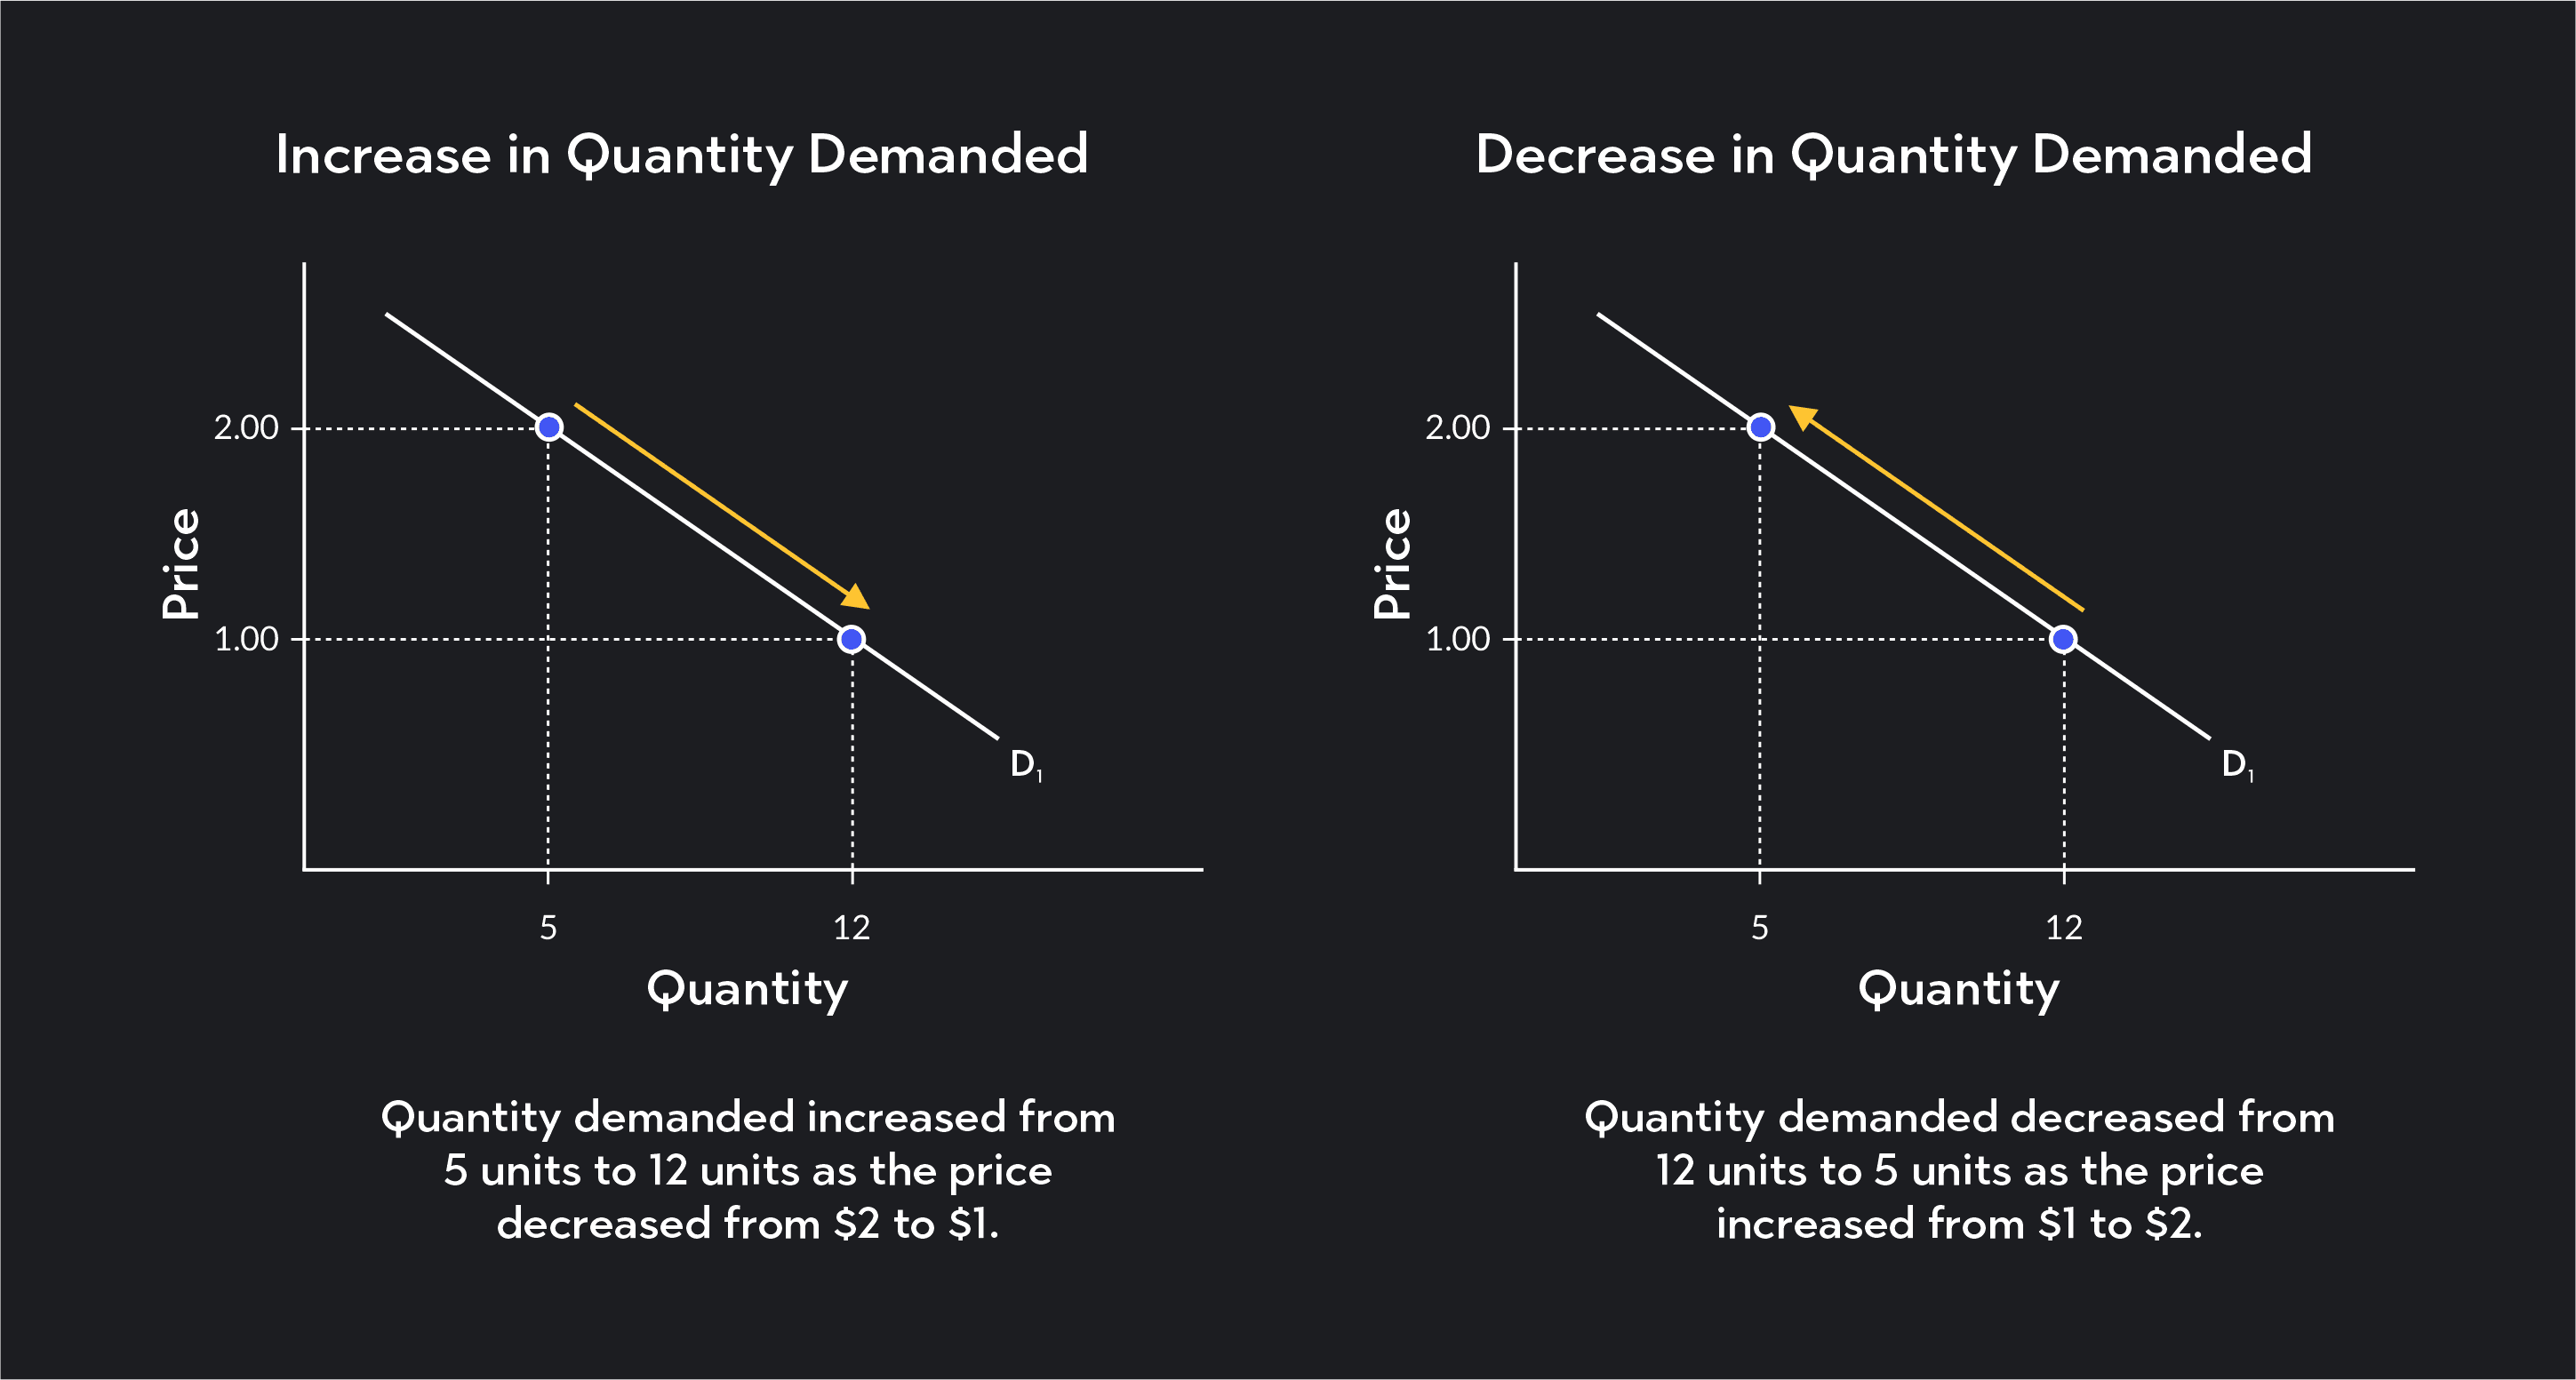
The law of demand states that, ceteris paribus, when price increases, quantity demanded falls, and when price decreases, quantity demanded rises. This occurs due to the substitution effect and income effect.
Change in Quantity Demanded vs Change in Demand
A change in quantity demanded is caused by a change in price and is represented by a movement along the demand curve.
A change in demand is caused by non-price factors and is represented by a shift of the demand curve.
Non-Price Determinants of Demand
Demand may change due to changes in:
- Income
- Tastes and preferences
- The number of buyers
- Prices of related goods (substitutes and complements)
- Expectations about future prices
For substitutes, an increase in the price of one good increases demand for the other. For complements, an increase in the price of one good decreases demand for the other. If consumers expect prices to rise in the future, current demand may increase due to stockpiling.
Law of Supply
The law of supply states that, ceteris paribus, when price increases, quantity supplied increases, and when price decreases, quantity supplied falls. This is driven by the profit motive.
Non-Price Determinants of Supply
Supply may change due to factor prices such as wages and fuel, improvements in technology, changes in the number of sellers, indirect taxes and subsidies, weather conditions, and changes in prices of related goods in production.
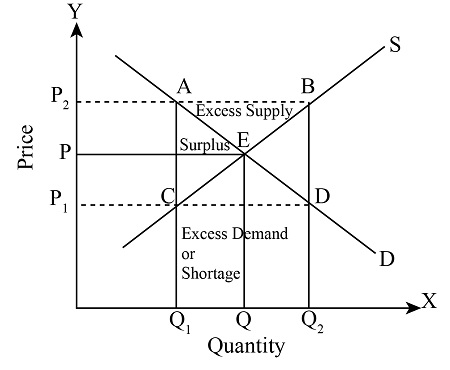
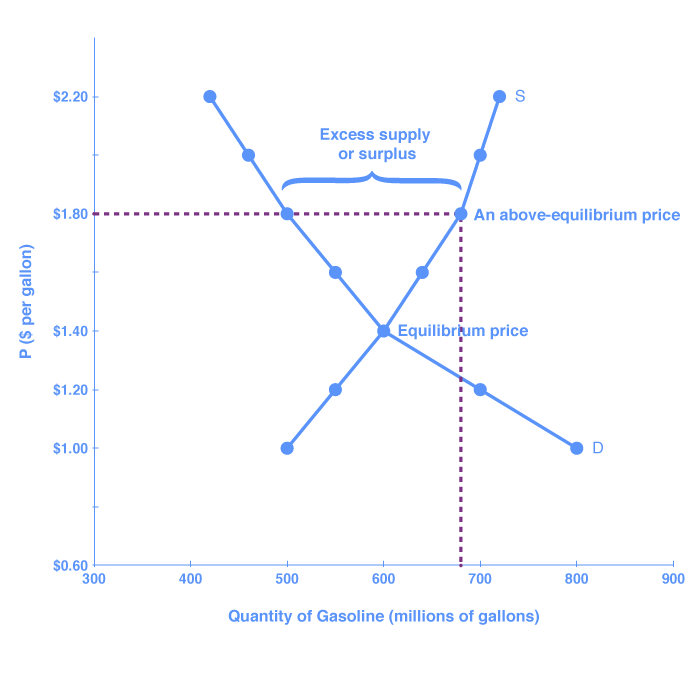
Market Equilibrium
Market equilibrium occurs where quantity demanded equals quantity supplied. At this point, there is no tendency for price to change.
Disequilibrium
A surplus occurs when quantity supplied exceeds quantity demanded, creating downward pressure on price.
A shortage occurs when quantity demanded exceeds quantity supplied, creating upward pressure on price.
The price mechanism adjusts prices to eliminate surplus or shortage and restore equilibrium.
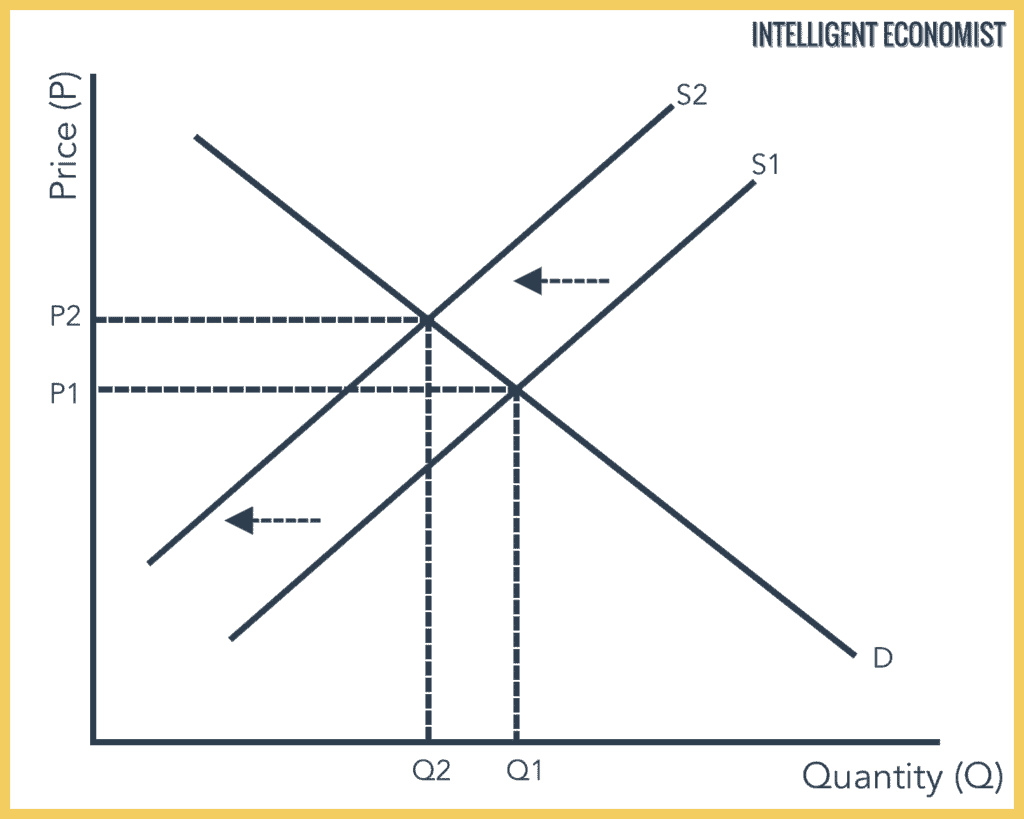
Adjustment Process
A non-price determinant causes demand or supply to shift. At the original price, a surplus or shortage arises. Buyers or sellers respond to price incentives, causing price to change until a new equilibrium is reached.
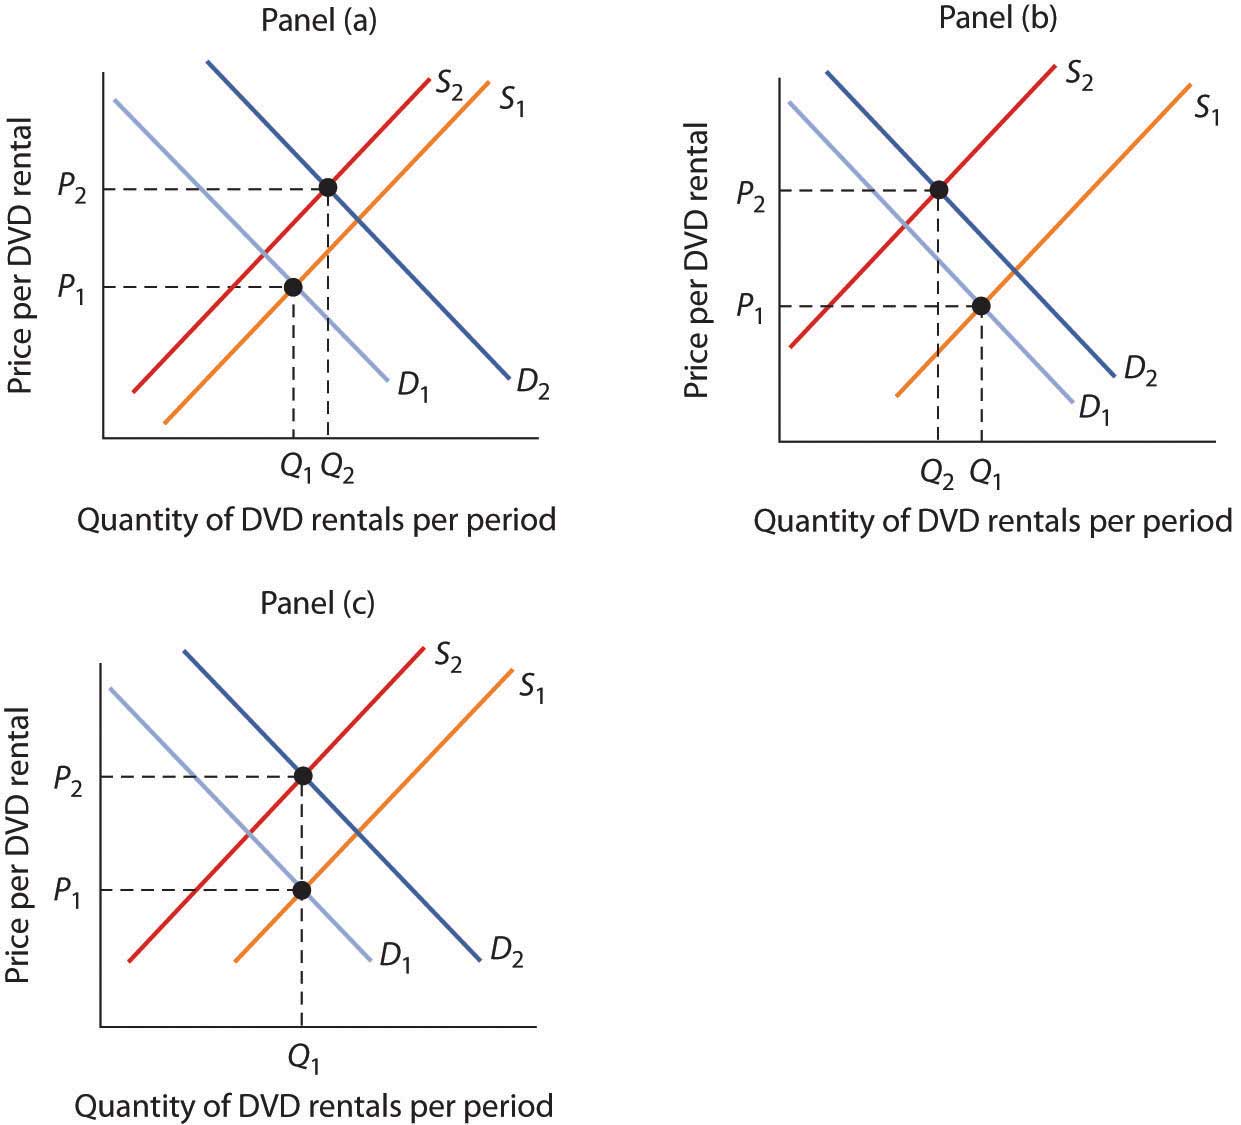
Double-Shift Analysis
When both demand and supply increase, equilibrium quantity always increases, while the effect on price depends on which curve shifts more.
When both demand and supply decrease, equilibrium quantity always decreases, while price is indeterminate.
When demand increases and supply decreases, price increases while quantity is indeterminate.
When demand decreases and supply increases, price decreases while quantity is indeterminate.
When both curves shift, one variable is indeterminate unless relative magnitudes are given.
Page 3 — Price Elasticity of Demand (PED)
Definition
Price elasticity of demand measures the responsiveness of quantity demanded to a change in price.
Formula
PED = % change in quantity demanded ÷ % change in price
Using the midpoint method:
%ΔQ = (Q2 − Q1) ÷ [(Q1 + Q2)/2] × 100
%ΔP = (P2 − P1) ÷ [(P1 + P2)/2] × 100
PED is usually negative, but interpretation is based on its absolute value.
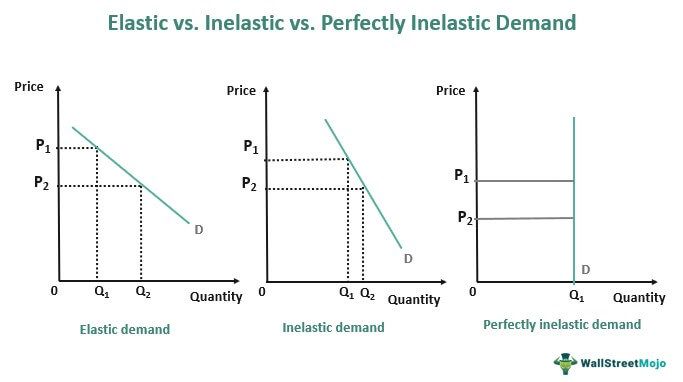
Classification
If |PED| > 1, demand is elastic.
If |PED| < 1, demand is inelastic.
If |PED| = 1, demand is unit elastic.
Perfectly inelastic demand has PED = 0, while perfectly elastic demand has PED = ∞.
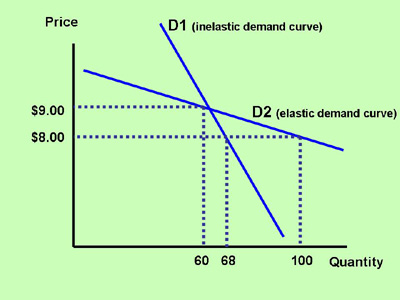
Determinants of PED
Demand is more elastic when close substitutes are available, when the good is a luxury, when it takes up a large proportion of income, and over a longer time period. Demand is more inelastic for necessities and habit-forming goods.
PED and Total Revenue
Total revenue is calculated as price multiplied by quantity.
When demand is elastic, an increase in price leads to a fall in total revenue.
When demand is inelastic, an increase in price leads to a rise in total revenue.
When demand is unit elastic, total revenue remains unchanged.
Application
Essential goods such as food and medicine tend to have inelastic demand. Firms facing inelastic demand may raise prices to increase total revenue. Brand-specific goods tend to have more elastic demand than the general product category.
Expectations
If consumers expect prices to rise in the future, current demand increases, potentially leading to demand-pull inflation.
Page 4 — Production, Costs, Profit & Policy
Short Run vs Long Run
In the short run, at least one factor of production is fixed. In the long run, all factors of production are variable.
Law of Diminishing Marginal Returns
The law of diminishing marginal returns occurs in the short run when increasing quantities of a variable input are combined with fixed inputs. Eventually, marginal product falls due to congestion and limited capital, assuming technology remains constant.
Increasing Marginal Returns
At low levels of output, marginal product may increase due to specialisation and division of labour before diminishing returns set in.
Costs
Total cost is the sum of total fixed cost and total variable cost.
Marginal cost is the additional cost of producing one more unit of output.
When marginal product falls, marginal cost rises.
Revenue
Total revenue equals price multiplied by quantity.
Marginal revenue is the additional revenue gained from selling one more unit.
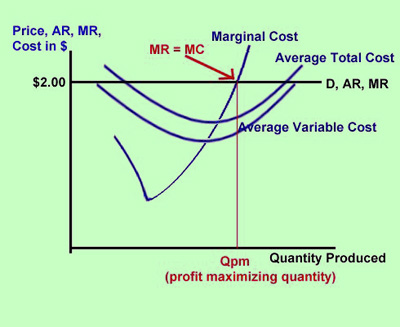
Profit Maximisation
A firm maximises profit when marginal revenue equals marginal cost.
If MR is greater than MC, the firm should increase output.
If MR is less than MC, the firm should reduce output.
Profit maximisation is not the same as revenue maximisation.
Market Power and Elasticity
Firms facing fewer substitutes experience more inelastic demand and greater pricing power. Trademarks and intellectual property rights reduce substitutes and lower elasticity.
Inflation
Demand-pull inflation arises from excess demand, such as panic buying and stockpiling.
Cost-push inflation arises from rising production costs, including wages, fuel, raw materials, and adverse weather conditions.
Exam Diagram Checklist
Ensure axes are labelled, curve shifts are correct, original and new equilibrium points are shown, and written explanations match the diagram.